
Light Data
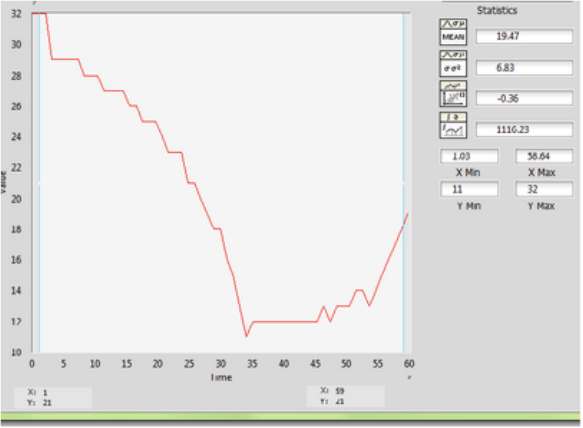
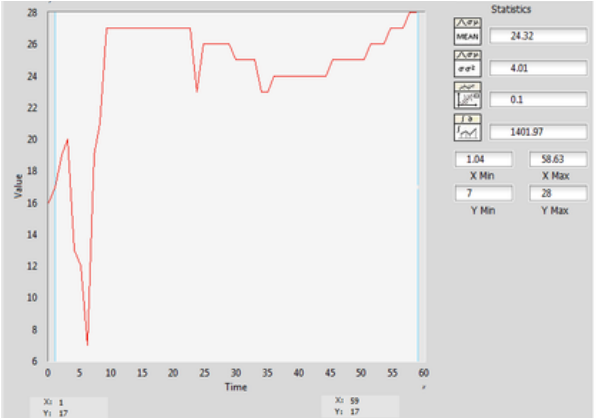
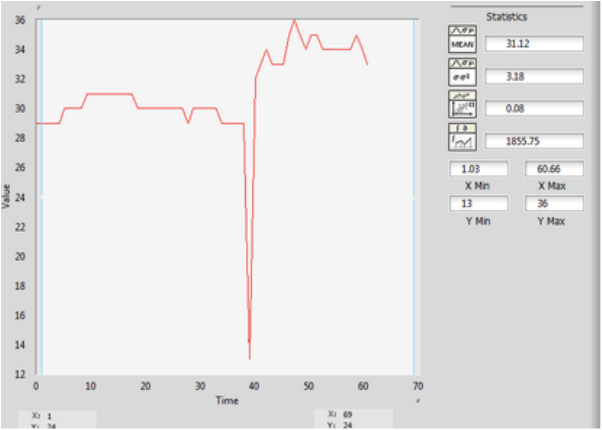
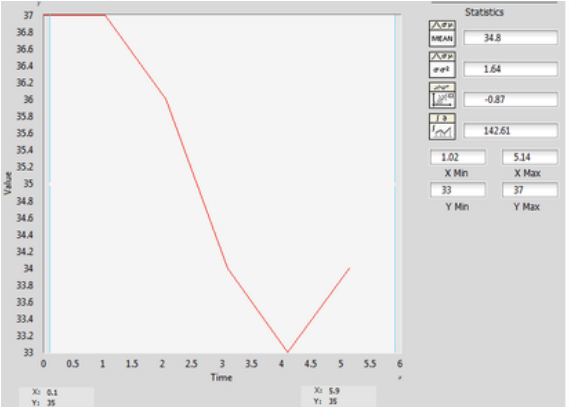
Each graph demonstrates where the natural light comes into the room. It took the robot about 3 minutes to travel around the table collecting data every 60 seconds.
- The most amount of light location: Right near the window (found in first graph with the first two seconds)
- The least amount of light location: Behind the table (within three minutes there was a dramatic decrease in light value)
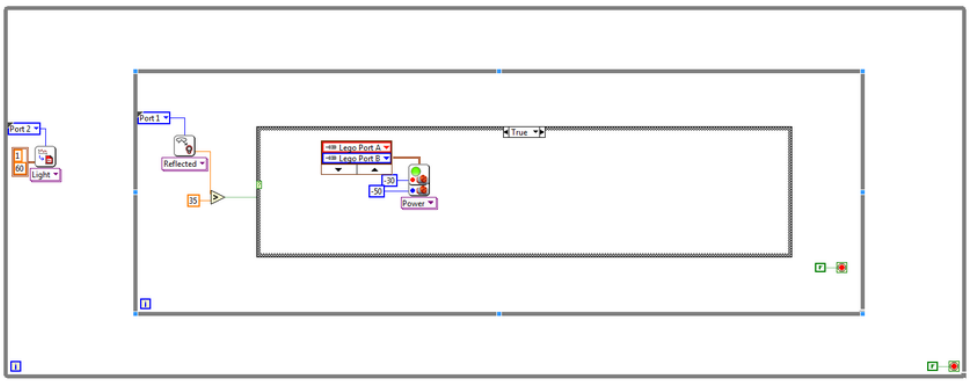
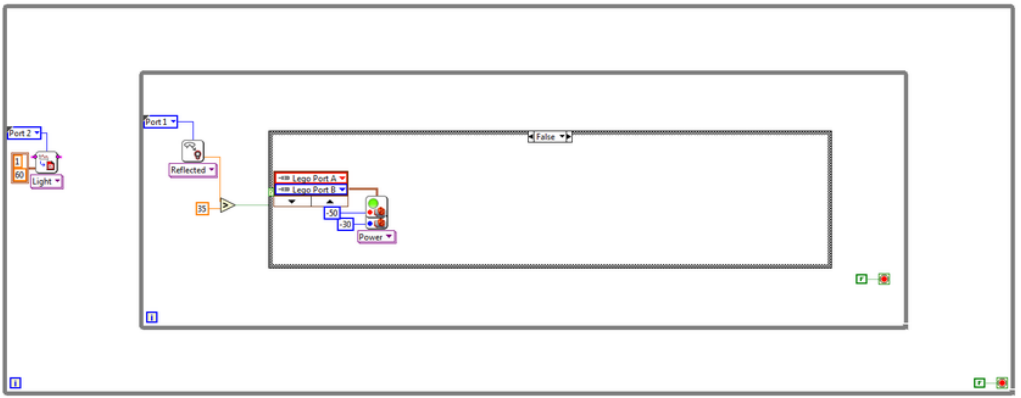
Program
VIDEO
One light sensor was planted upward on top of the robot to collect the amount of light. Another light sensor was planted downward towards the front of the robot to follow the line.
